There was already an article on this a couple of years ago: How to Draw Scientific Diagrams with Sonnet 3.7.
Even then, the model’s drawing ability was pretty astonishing. As models have improved, we now have a better way to get more elegant layouts and make finer adjustments. So I wanted to write up my own experience here.
This workflow is built entirely around the ChatGPT ecosystem, so have a working ChatGPT Plus subscription or above ready.
First, decide what kind of diagram you want—for example, something in an SCI or IEEE style. Open Draw.io.
Then find a reference image. I picked an arXiv paper, 2605.25553, and took a screenshot of one of its figures:
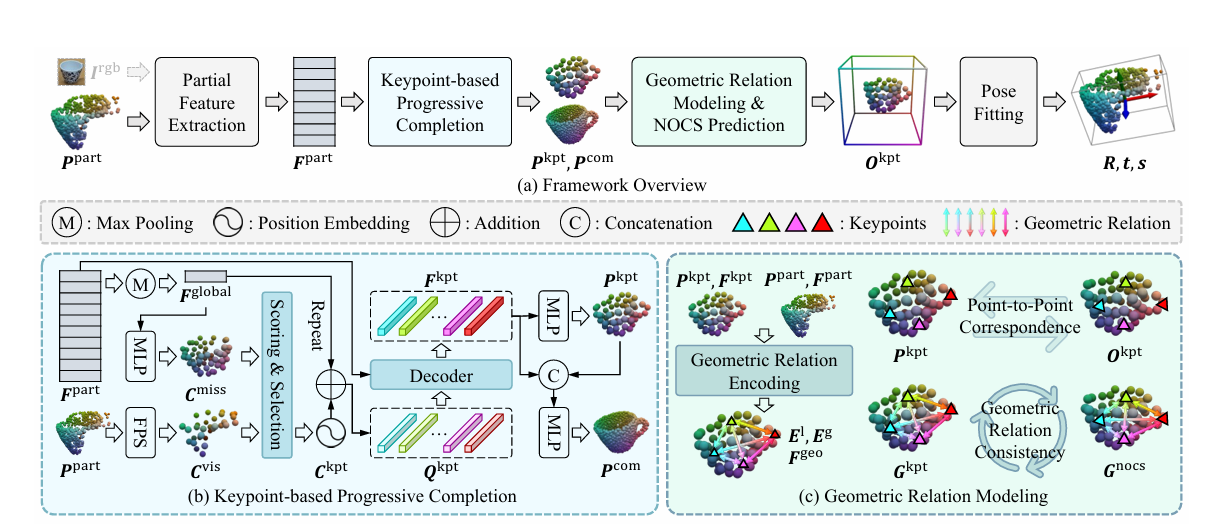
Open Codex (ChatGPT), load the relevant repository, and have it review the codebase. Enter a prompt like this. Here I used my website’s comment system as the example, with GPT-6.1 Sol as the model:
Using this figure as a reference, map out the architecture of this project’s comment system. Call image generation to create an architecture diagram in an SCI/IEEE style suitable for a top-tier conference.
It returned an image that looked pretty good:
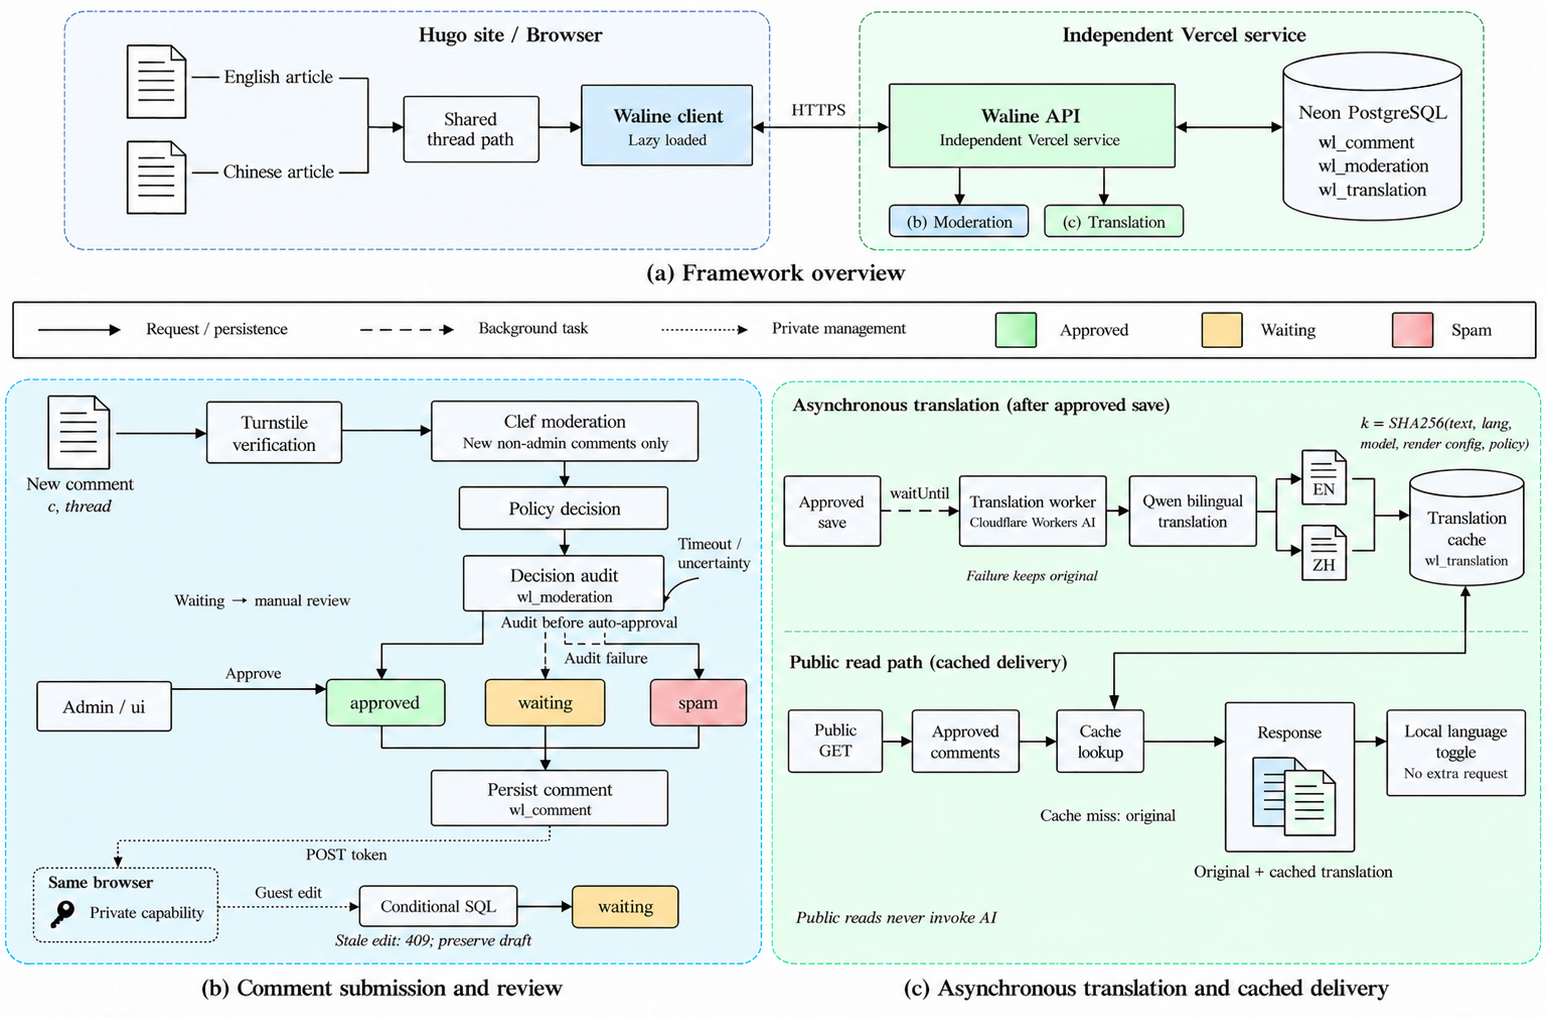
In the same conversation, switch the model to GPT-6 Astra, then send:
Create a Draw.io file on my desktop and recreate this diagram using code.
It gave me a file, which I dragged into Draw.io:
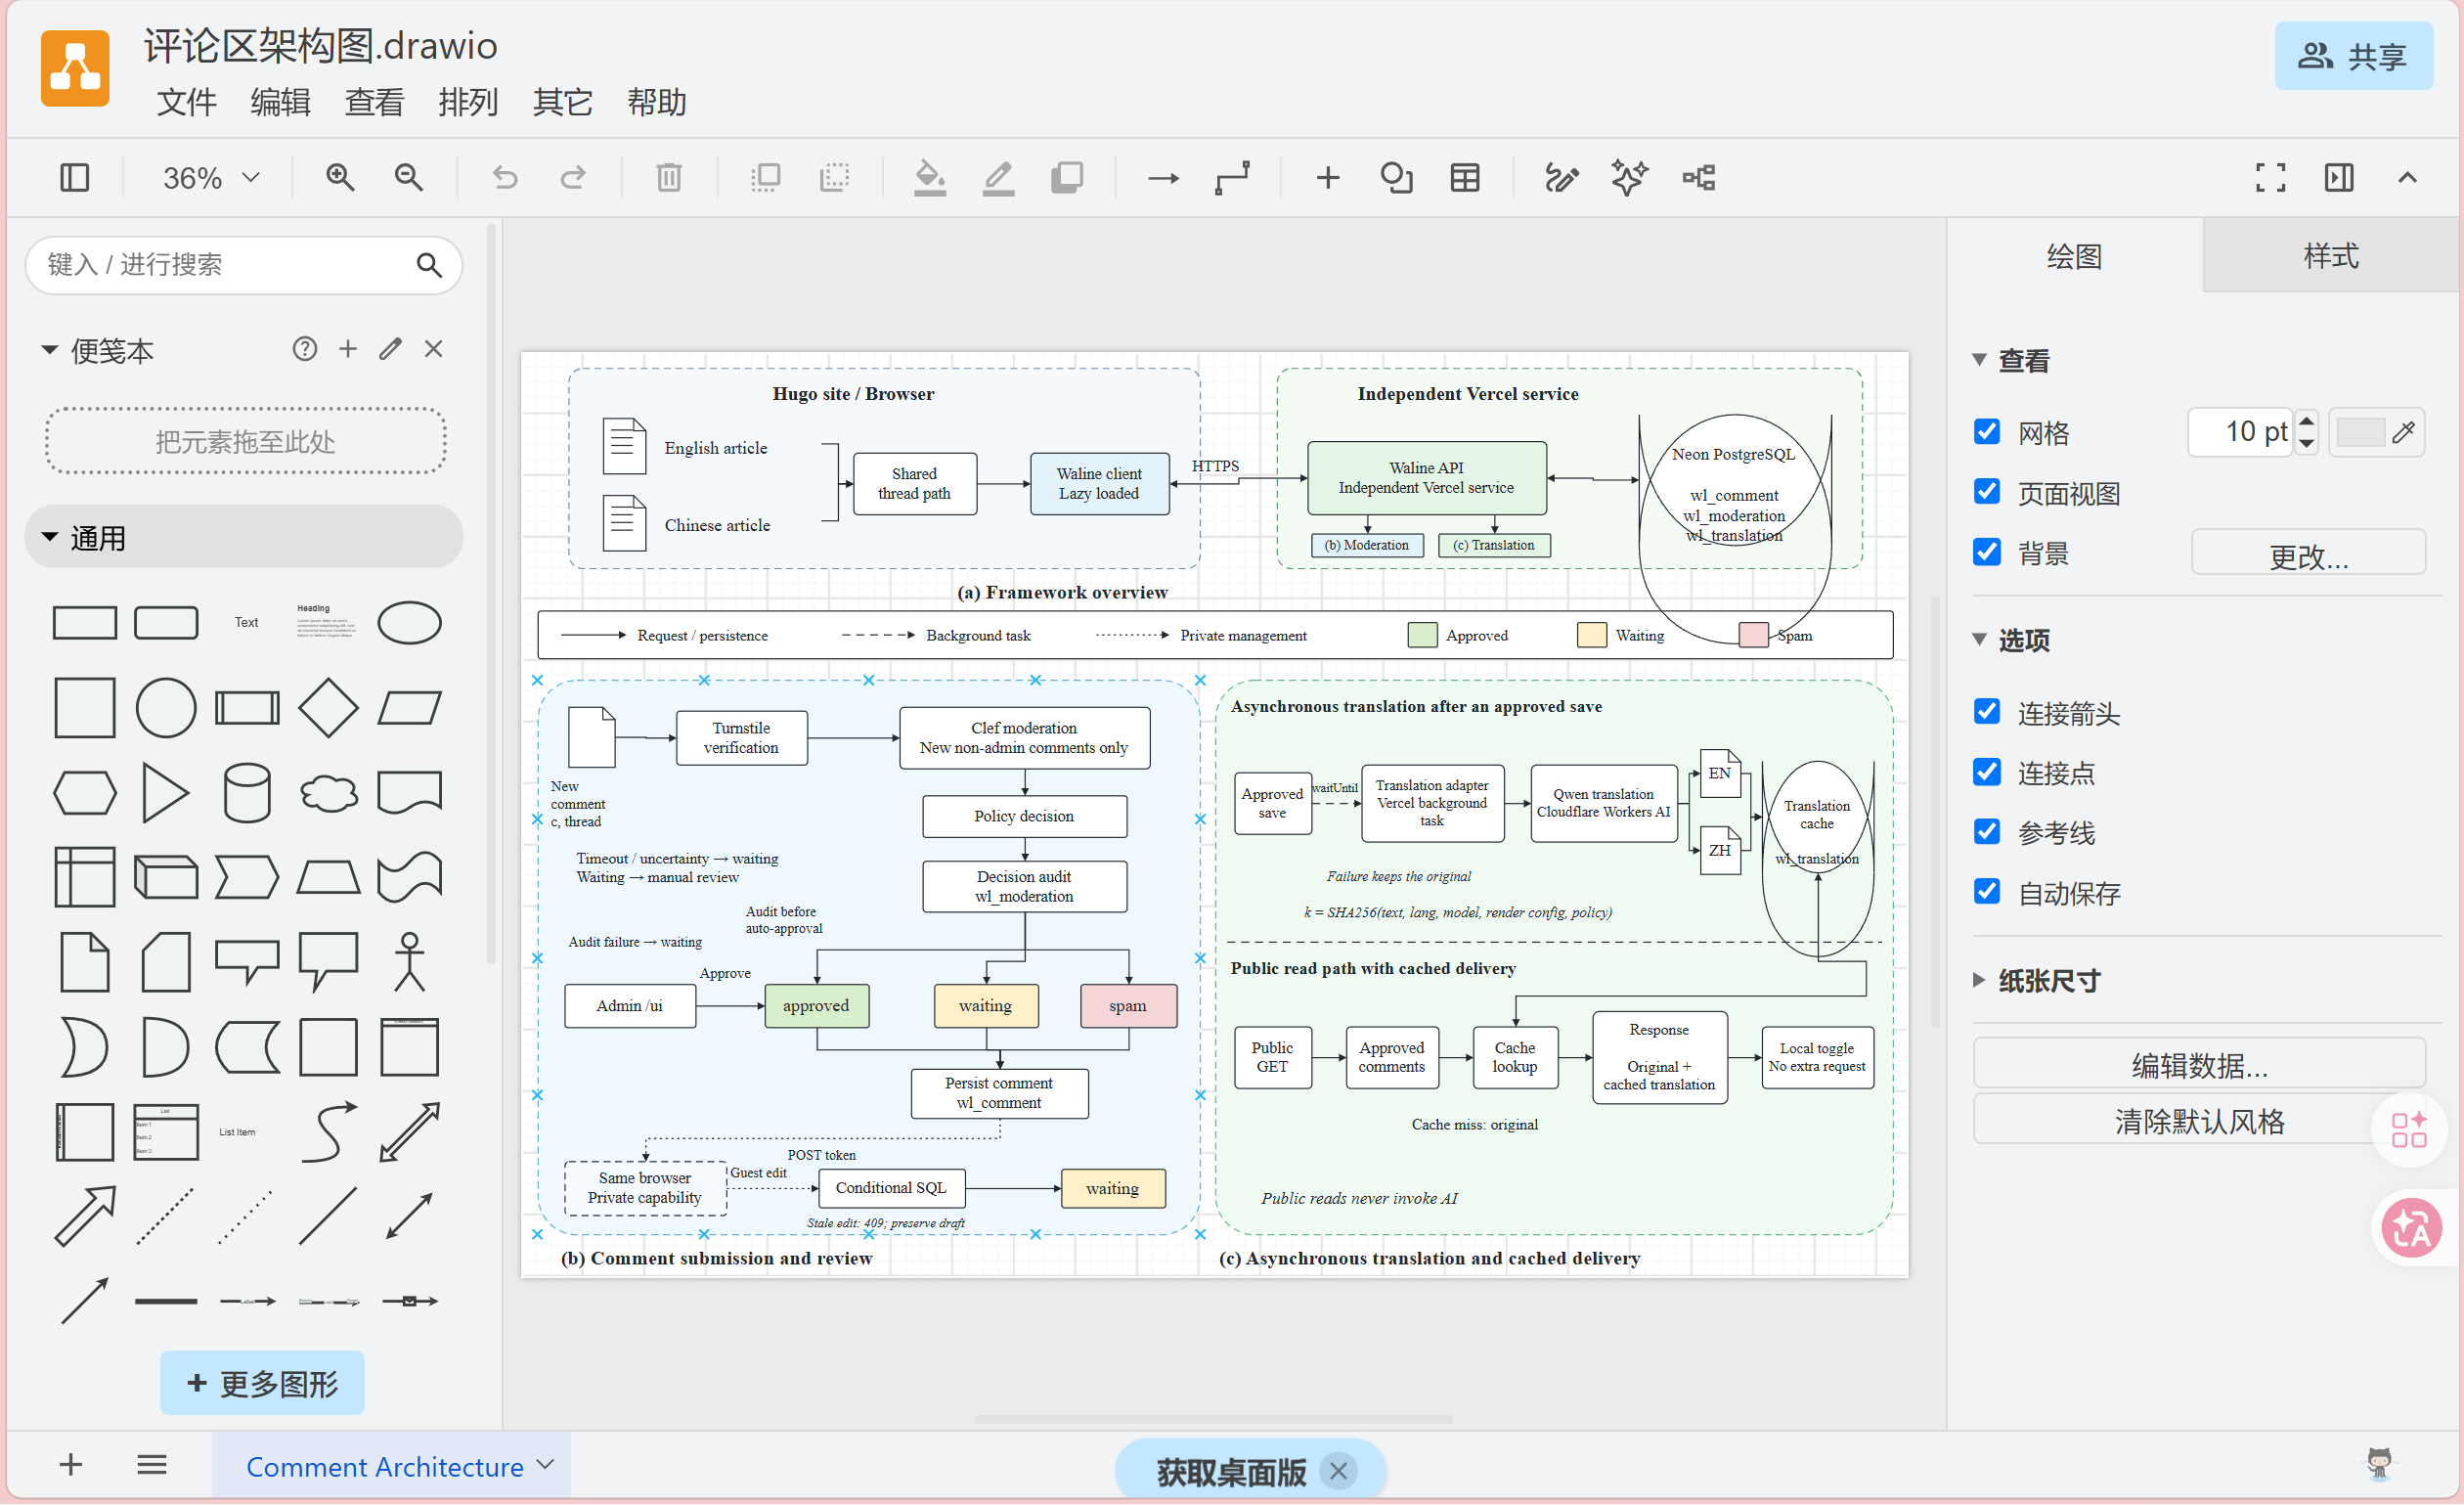
That didn’t look quite right, so I sent the AI a screenshot and asked it to fix the diagram:
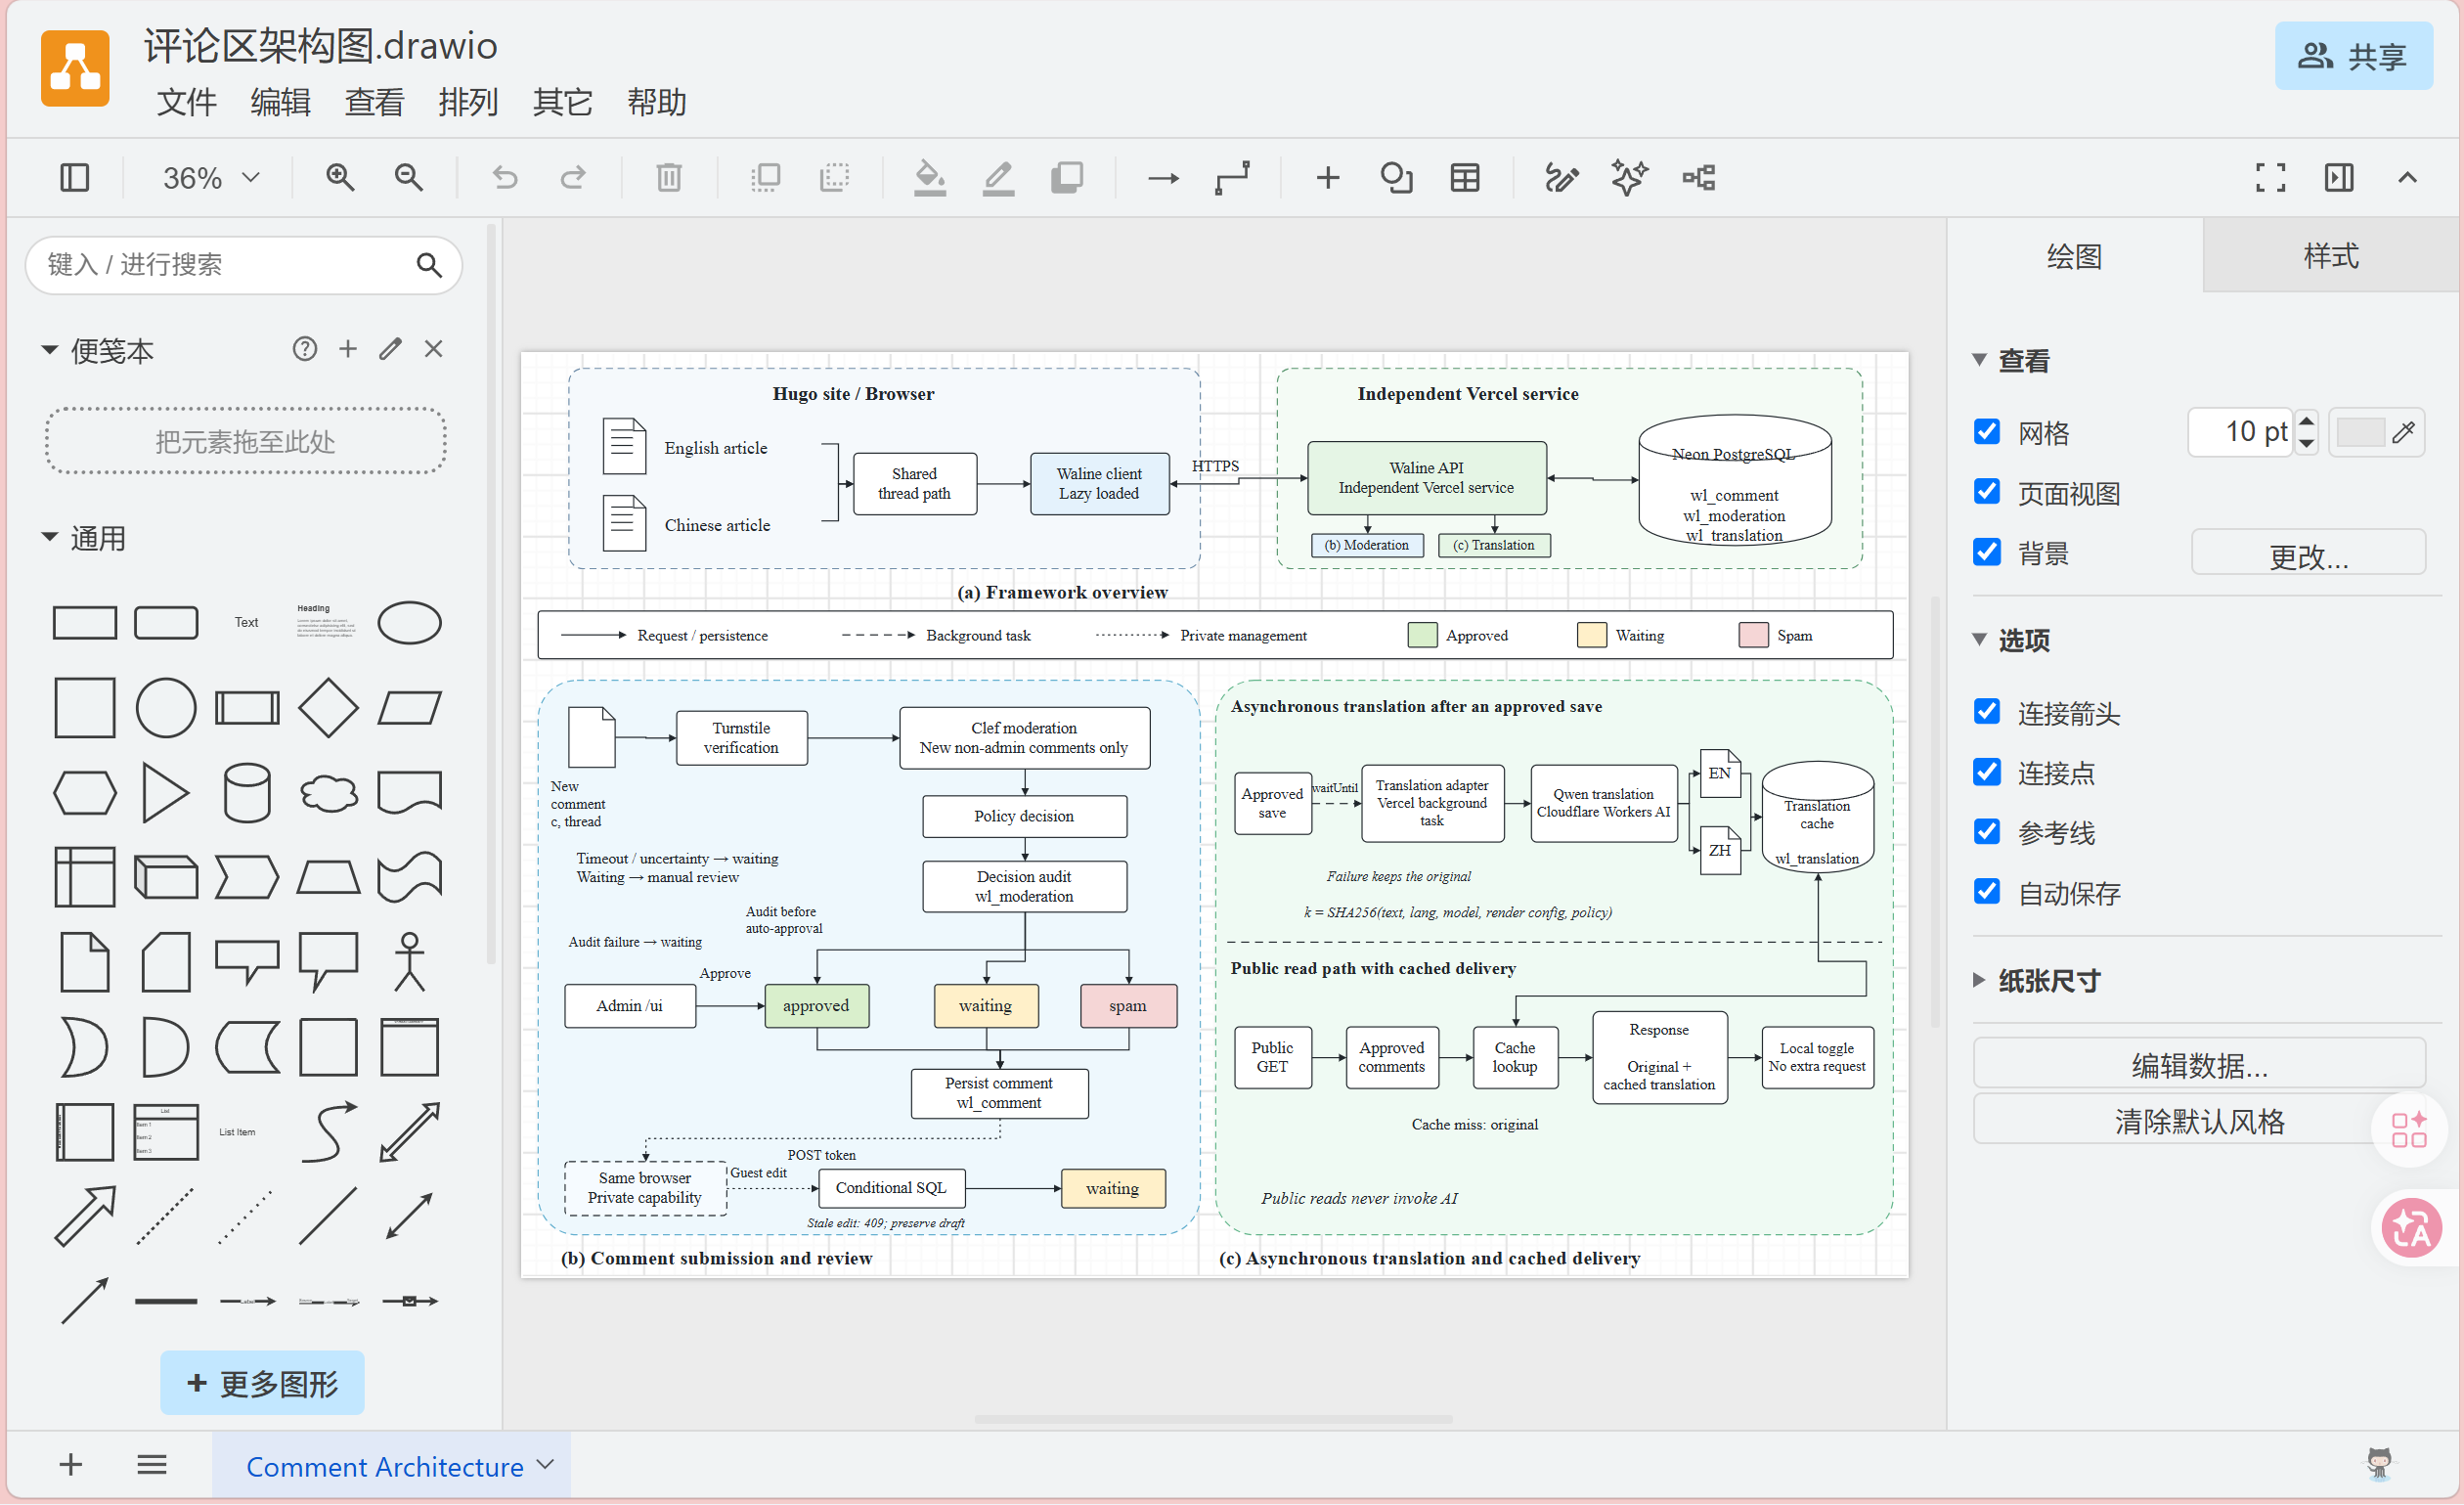
Much better. After that, a little manual adjustment of the connectors was all it needed.
You can download the resulting file here:
Download the editable comment-system architecture diagram (Draw.io)
Further tweaks to the diagram follow much the same process.
If you have any questions, feel free to leave a comment below~
Comments
Comments appear after moderation. Email is optional and stays private. Privacy